


Explore data analysis with Python. Pandas DataFrames make manipulating your data easy, from selecting or replacing columns to reshaping your data.
What is Pandas?
 It is characterised by its bold black-and-white coat and rotund body. Just Kidding...By the way, I find them really cute.
=> Pandas is a software library mainly used for data analysis. It is used to import data from various file format such as JSON, CSV, SQL etc. It also allows various data manipulation operation such as merging, reshaping, data cleaning etc.
Fun Fact => The word panda came from Panel Data, an econometrics term for data sets that include observations over multiple time periods for the same individuals.
Why Pandas?
- It provides simple but capable set of functions that can be used on your data.
- It is much faster than excel and also integrated with many other data science and machine learning tools which use Python, so having an understanding of it will be helpful throughout your journey.
- Mainly, Pandas is used to transform your data in a way that makes it usable with machine learning algorithms.
Let's Get Started
Datatypes
The first step is to import pandas. The most common way is to import pandas is with the abbreviation pd.
import pandas as pd
Pandas has 2 main datatypes:
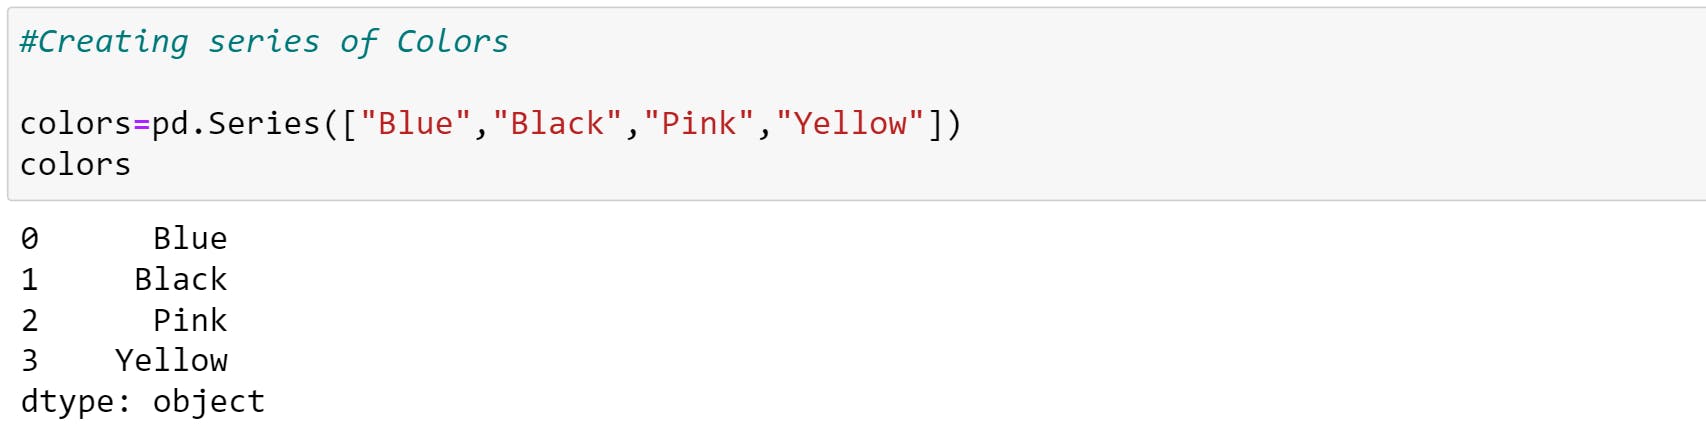
- Series: One-dimensional array holding data of any type.
- DataFrame: Two-dimensional array holding data of any type. It can be visualized as a spreadsheet.
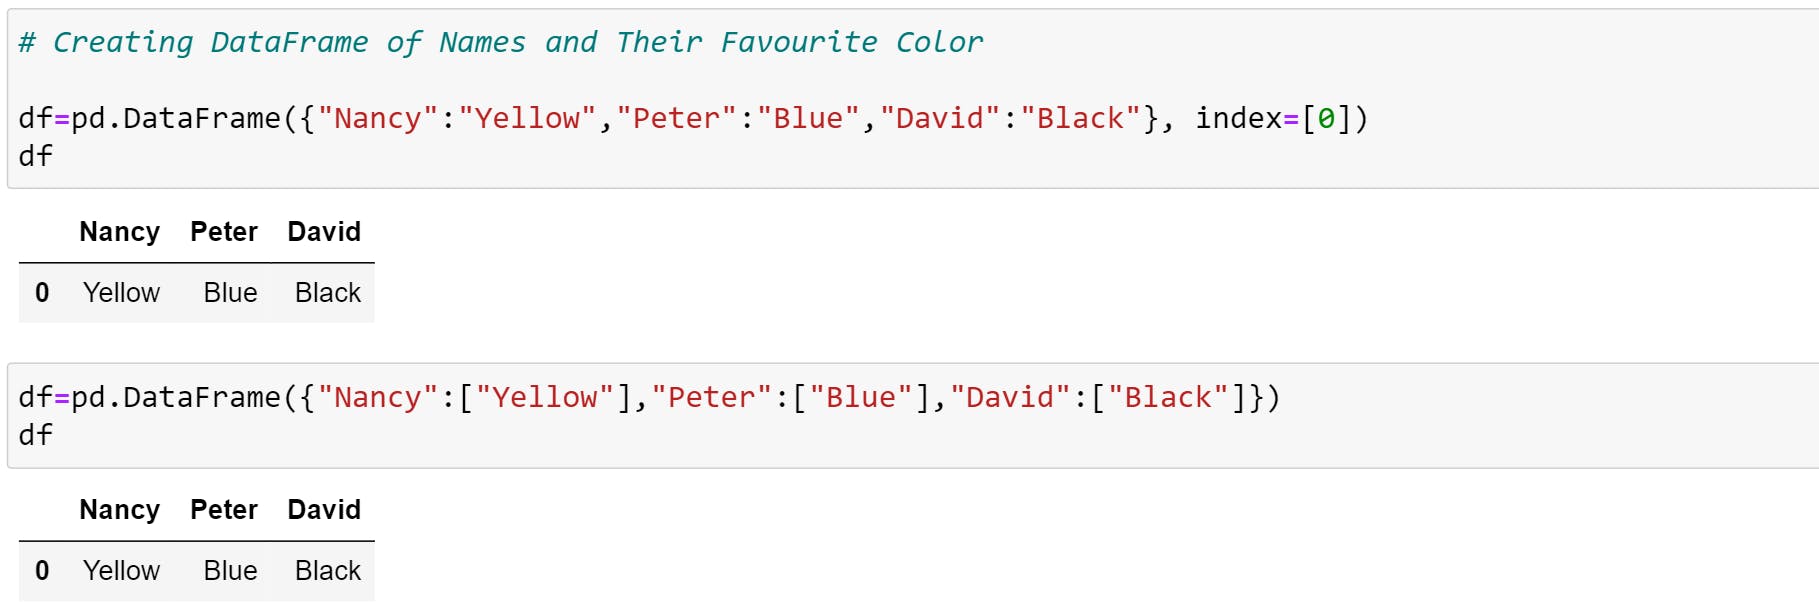
Note: If you are directly using the dictionary, make sure to add index values else you will get an error. Or you can use the list to pass as shown above.
You can also pass series as values to DataFrame.
You can see the keys of the dictionary became the column headings (text in bold) and the values became the values in the DataFrame.
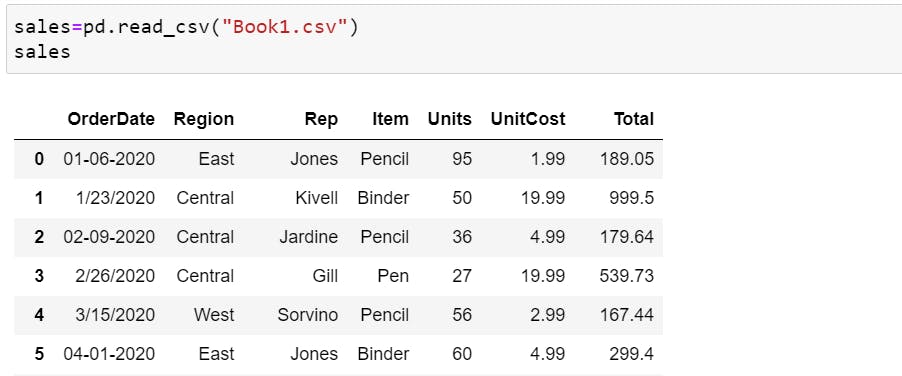
Creating Series and DataFrame's from scratch is cool but what you'll usually be doing is importing your data in the form of a .csv (comma-separated value) as pd.read_csv() or spreadsheet file pd.read_excel().
After you've made a few changes to your data, you might want to export it and save it. Pandas allows you to export DataFrame's to .csv format using .to_csv() or spreadsheet format using .to_excel().
sales.to_csv("exported_book1.csv")
Describing Data
Pandas has many built-in functions which allow you to quickly get information about a DataFrame such as :
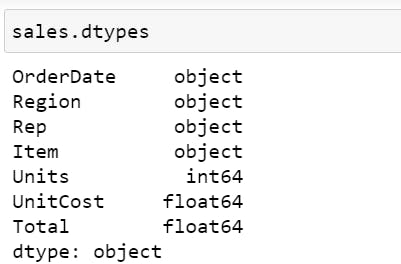
.dtypes shows us what datatype each column contains.
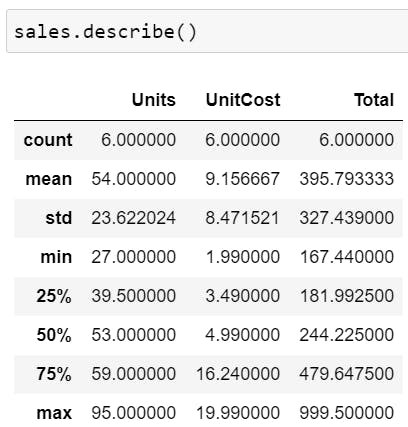
.describe() gives you a quick statistical overview of the numerical columns.
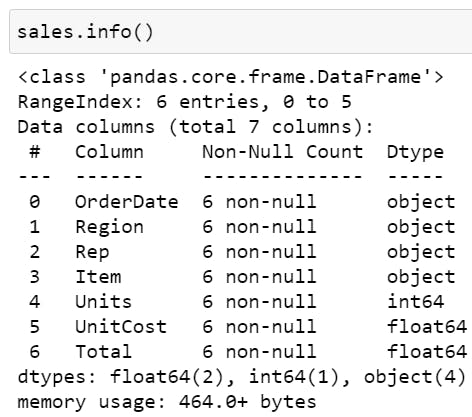
.info() shows how many entries (rows) there are, whether there are missing values (if a columns non-null value is less than the number of entries, it has missing values), datatypes etc.
Similarly,
.columns will show you all the columns of a DataFrame. By default, the Index starts with zero.
sales.columnsOutput=>Index(['OrderDate', 'Region', 'Rep', 'Item', 'Units', 'UnitCost', 'Total'], dtype='object')
.index will show you the values in a DataFrame's index (first column).
car_sales.index #Output=>RangeIndex(start=0, stop=6, step=1)- len shows the length of DataFrame
len(sales)
#Output=>6. So index will go from 0-5
Viewing, Selecting & Sorting Data
=>In practice, you'll constantly be making changes to your data, and view it.
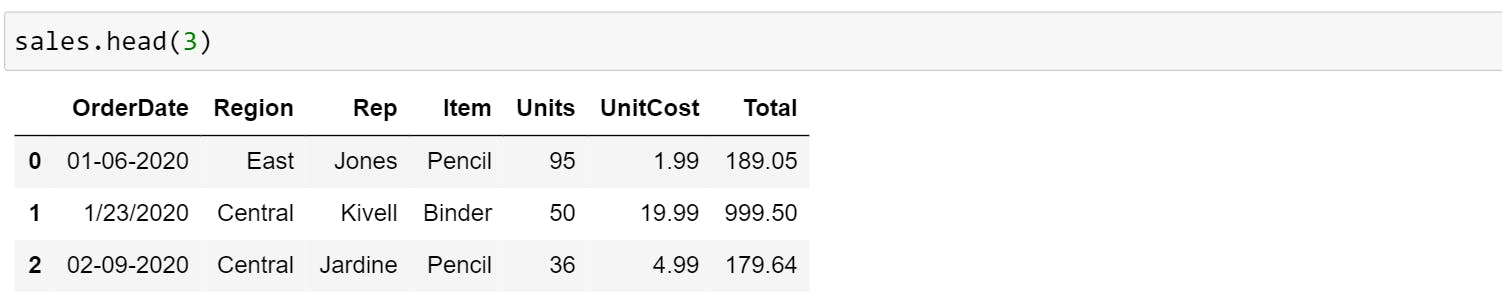
- head() function, by default, shows only the top 5 rows of data in the DataFrame. Pass in a number and Pandas will print out the specified number of rows as shown in the example below.
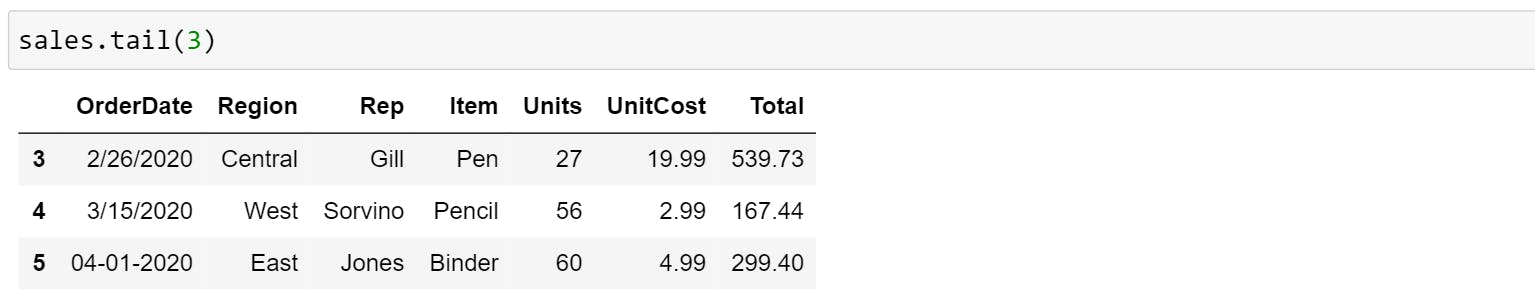
- tail() opposite to head() shows only the bottom 5 rows of data in the DataFrame. It will print the number of rows if the mentioned as a parameter in the function.
You can also use .loc[] and .iloc[] to select data from your Series and DataFrames. To understand the use let us create series with a custom index.
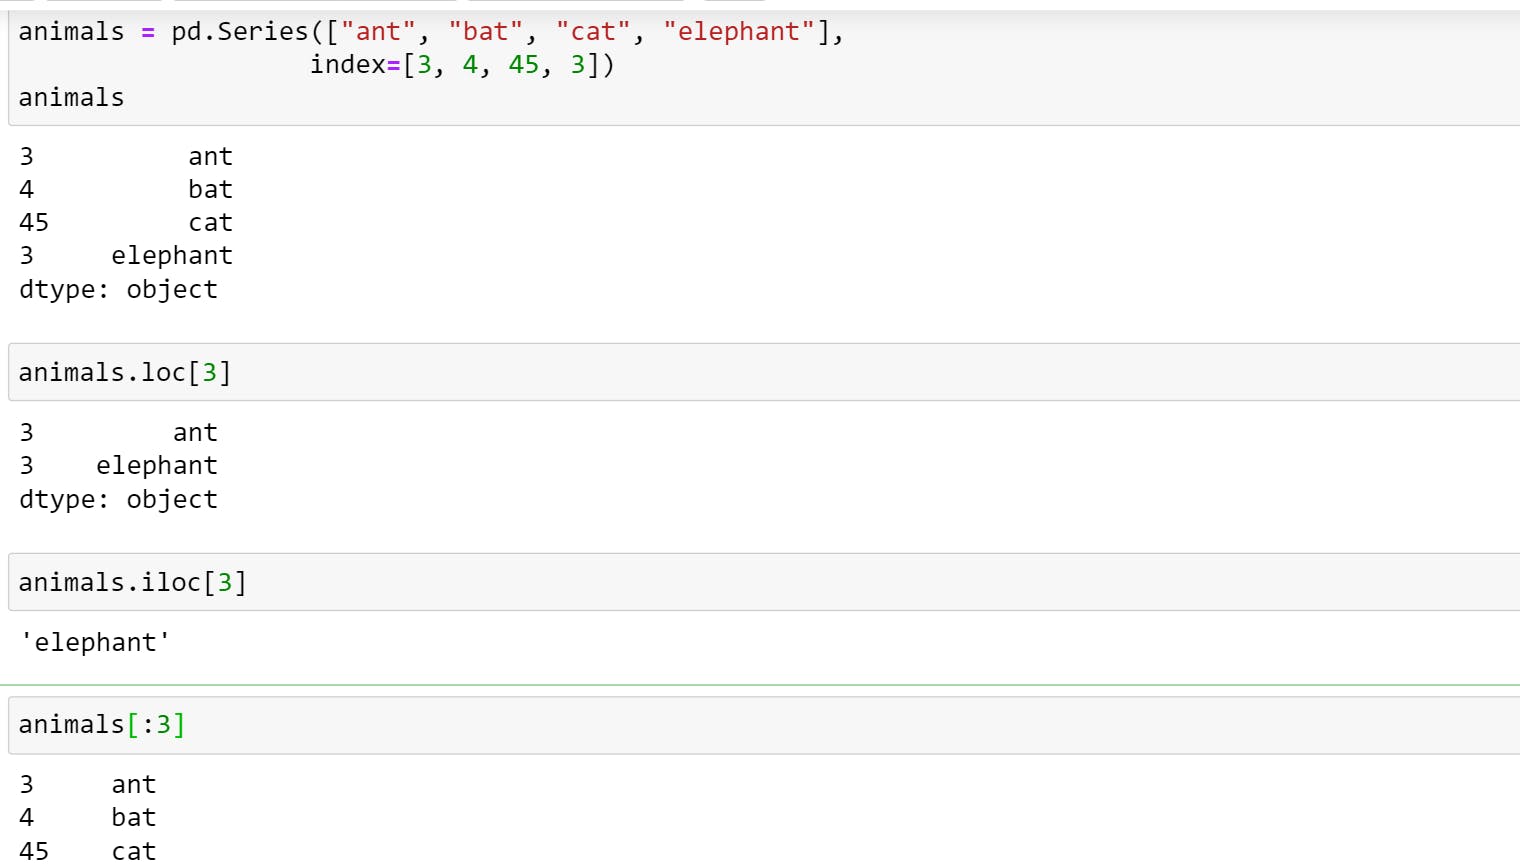
- Use .loc[] when you're referring to indexes.
- Use .iloc[] when you're referring to positions in the DataFrame (index is out of order).
- You can also perform slicing on the data
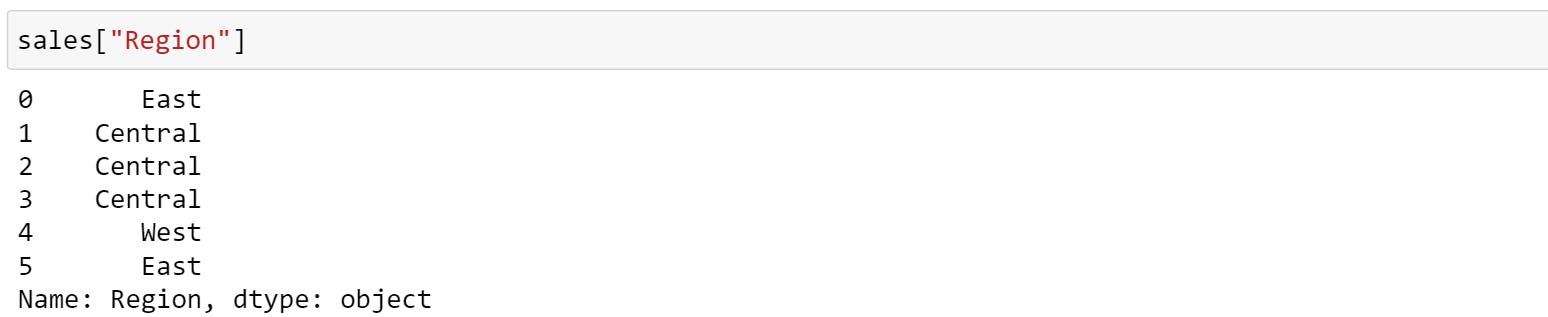
=>If you want to select a particular column, you can use ['COLUMN_NAME'].
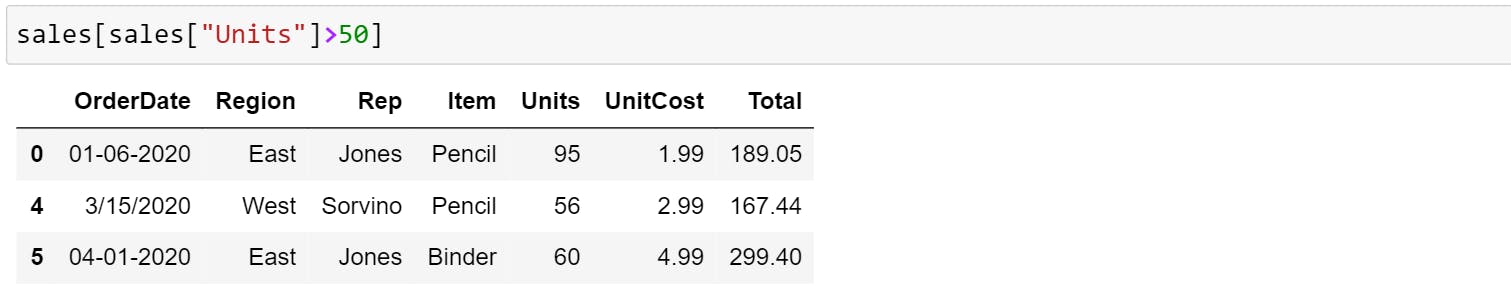
You can also select the data based on condition. For example,
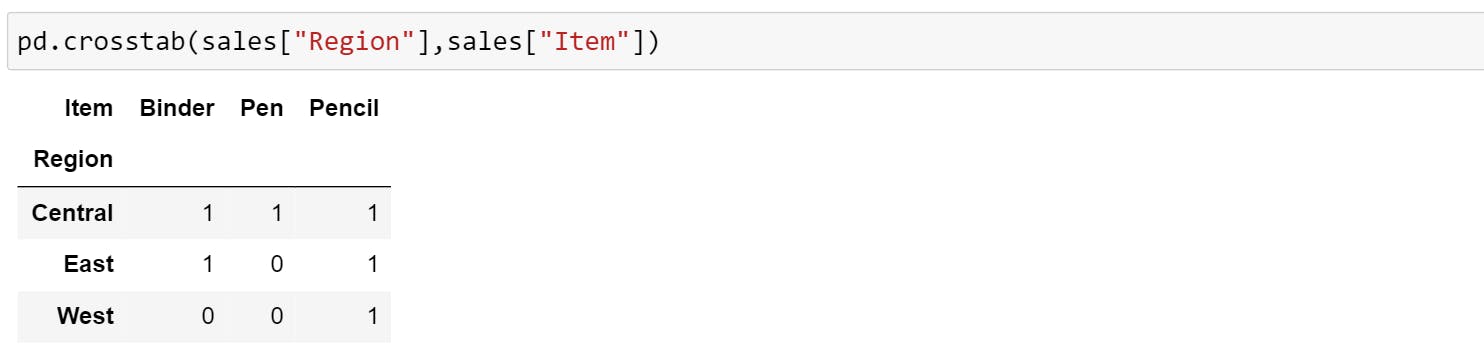
If you want to view two different columns together and compare them then you should use pd.crosstab().
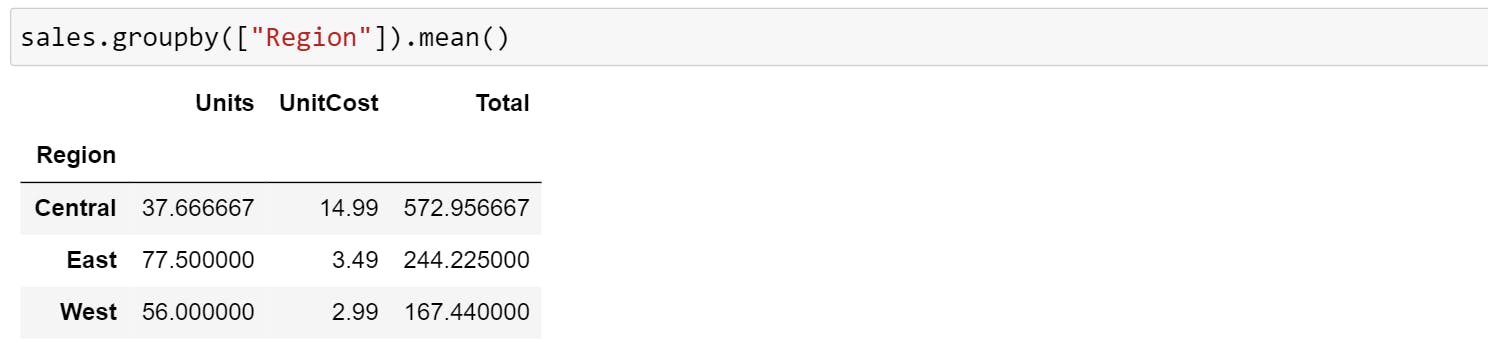
If you want to compare more columns in the context of another column, you can use .groupby(). The below examples group rows by Region and mean of all the numerical column that belongs to that group.
Transpose
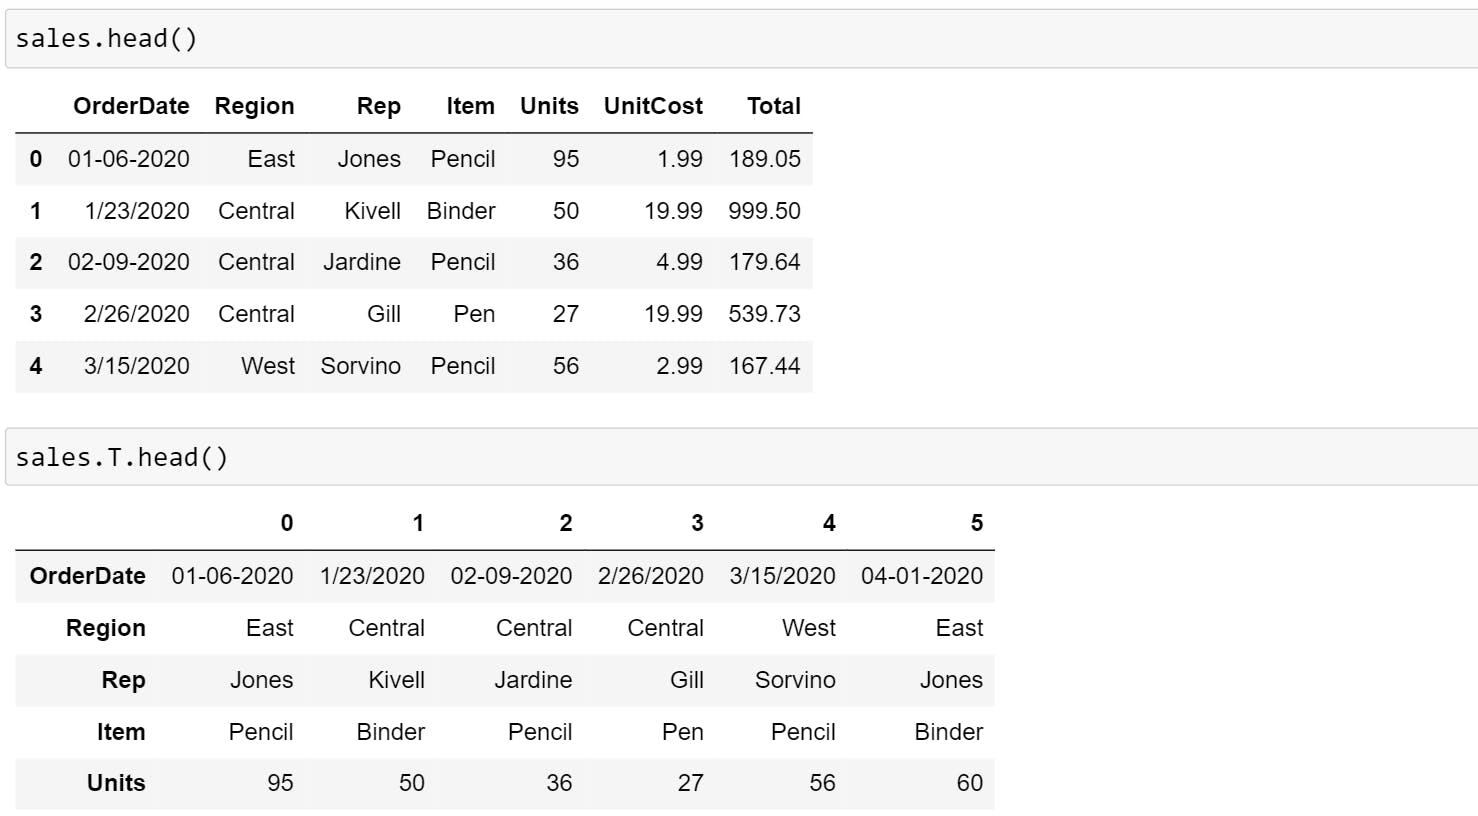
You can use the T attribute or the transpose() method to swap or transpose the rows and columns of pd.DataFrame. The method doesn't change the original object but returns a new object with the rows and columns swapped (ie transposed object).
 In the above example,
- First block shows the first 5 rows of DataFrame where indexes are rows and OrderDate, Region, Rep etc are columns.
- Second block shows the transposed object where indexes are columns and OrderDate, Region, Rep etc are rows. Here, because of
.head()only 5 rows is shown.
Sorting
You can sort index in two ways:
- Sorting by an Axis: Basically, the sorting algorithm is applied on the axis labels rather than the actual data in the DataFrame and based on that the data is rearranged.
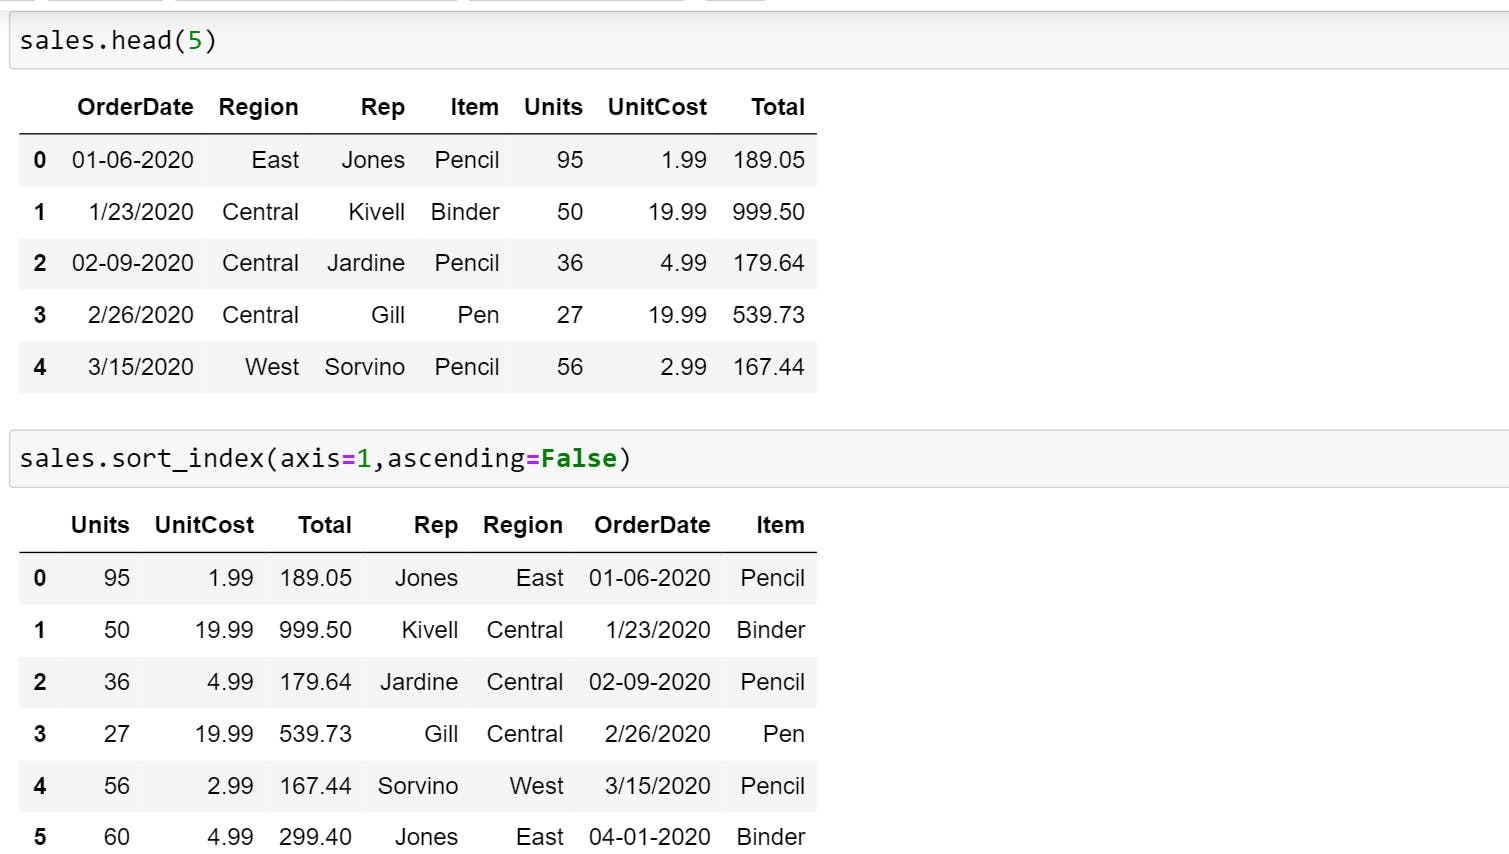 Note: In DataFrame, you will use axis=1 for columns and axis=0 for rows.
Here as you can observe, the data is rearranged alphabetically based on column labels instead of data itself. Item comes first, followed by OrderDate, Region, Rep etc.
Note: In DataFrame, you will use axis=1 for columns and axis=0 for rows.
Here as you can observe, the data is rearranged alphabetically based on column labels instead of data itself. Item comes first, followed by OrderDate, Region, Rep etc.
sales.sort_index(axis=1,ascending=False)
#It will sort in descending order
- Sorting by Values: The data here is sorted based on the values of a particular column.
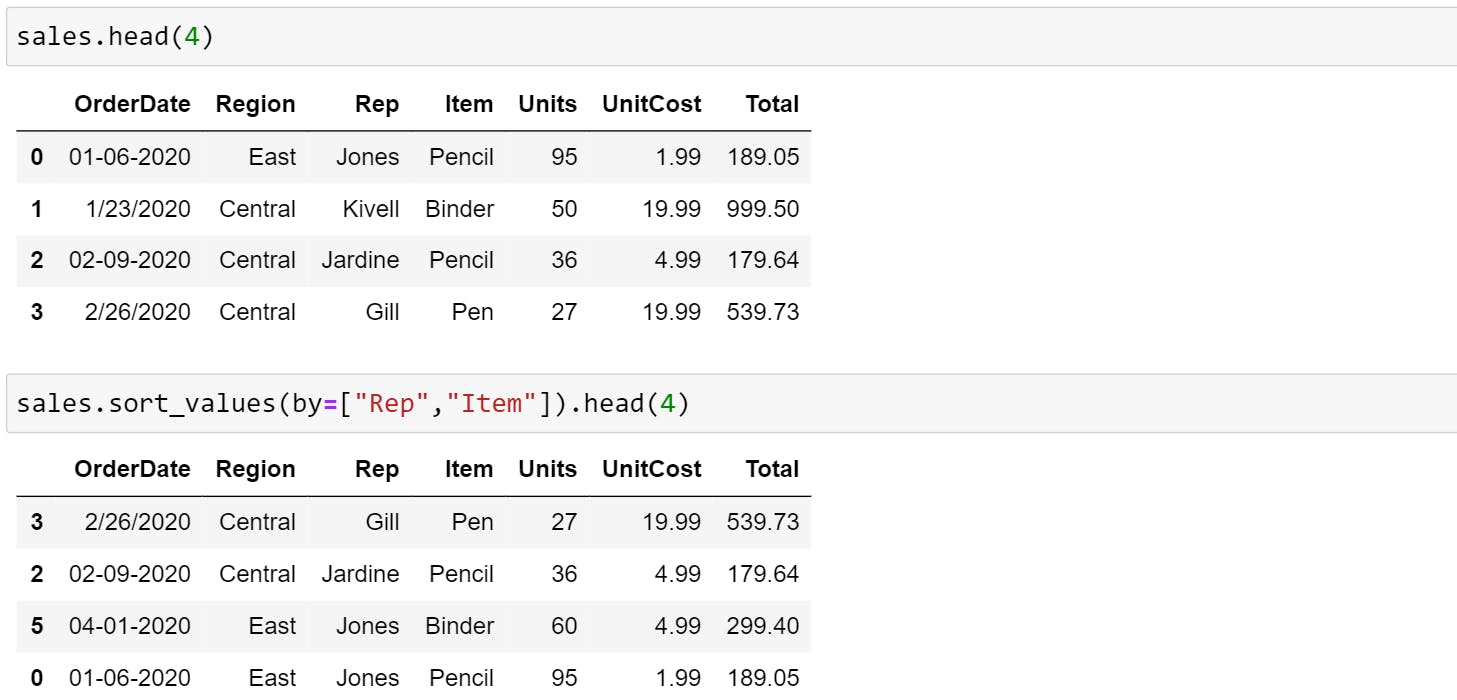 You can also sort data by multiple columns as shown below. Here, the column mentioned first will be given priority.
sales.sort_values(by=["Rep","Item"]).head(4)
Operations On Data
There are many operations that can be performed. Here are 5 that you may use regularly.
- Mean: Average Of Data
sales.mean() - Median: It returns the median value of the sorted set. If there are even numbers in the sorted set, then it will show the average of two middle values.
sales.median() - Mode: The value in a set that appears most often.
sales["Region"].mode() #Output=>Central, because it appears thrice. - Value_Counts: The resulting object will be in descending order so that the first element is the most frequently occurring element.
sales.value_counts() - Cumsum: Returns a DataFrame or Series of the same size containing the cumulative sum. You can use the below code to find the cumulative sum of the particular column.
sales["Units"].cumsum().lower()and.upper()operation on string datatype. You can also useconcatandjointo combine series or dataframe with various kinds of set logic for the indexes and relational algebra functionality.
Fill The Missing Value
In practice, it's likely you'll work with datasets that aren't complete. What this means is you'll have to decide whether how to fill in missing data or remove the rows which have data missing.
- To detect missing values, use
.isna()sales.isna() - To fill in the data with 0 or mean or any other value, use
.fillna#Fill the missing values of Units column with the mean and inplace=True sales["Units"].fillna(sales["Units"].mean(),inplace=True) - To remove rows with missing value use,
.dropna. By default, .dropna() has inplace=False as default. You can either set inplace=True or reassign the sales DataFrame.sales.dropna()
Plotting
Pandas even allow quick plotting of columns so you can see your data visually. To plot, you'll have to import matplotlib. If your plots aren't showing, try running the two lines of code below.
import matplotlib.pyplot as plt
%matplotlib inline
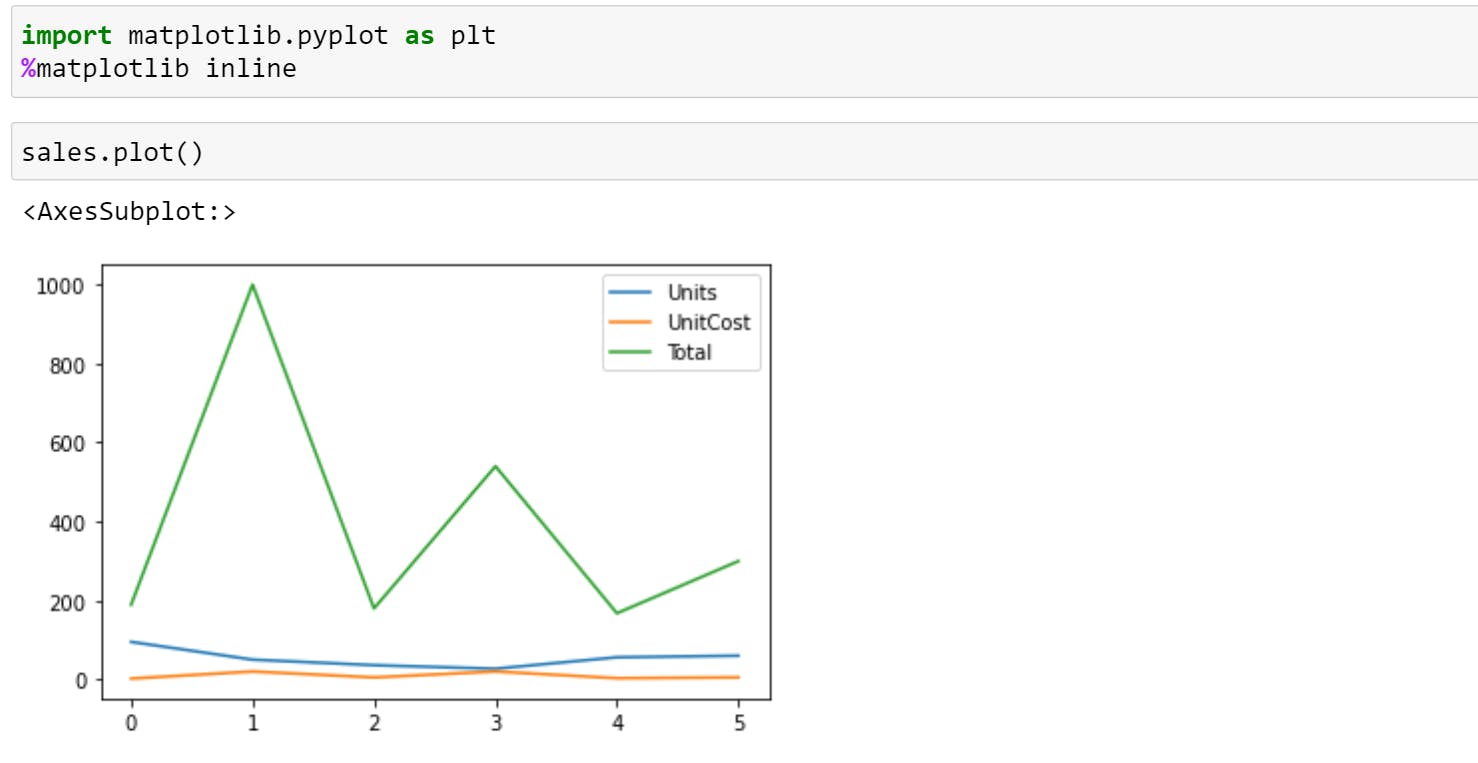
You can even visualize a column by calling .plot() on it. For Example,
sales["Units"].plot()
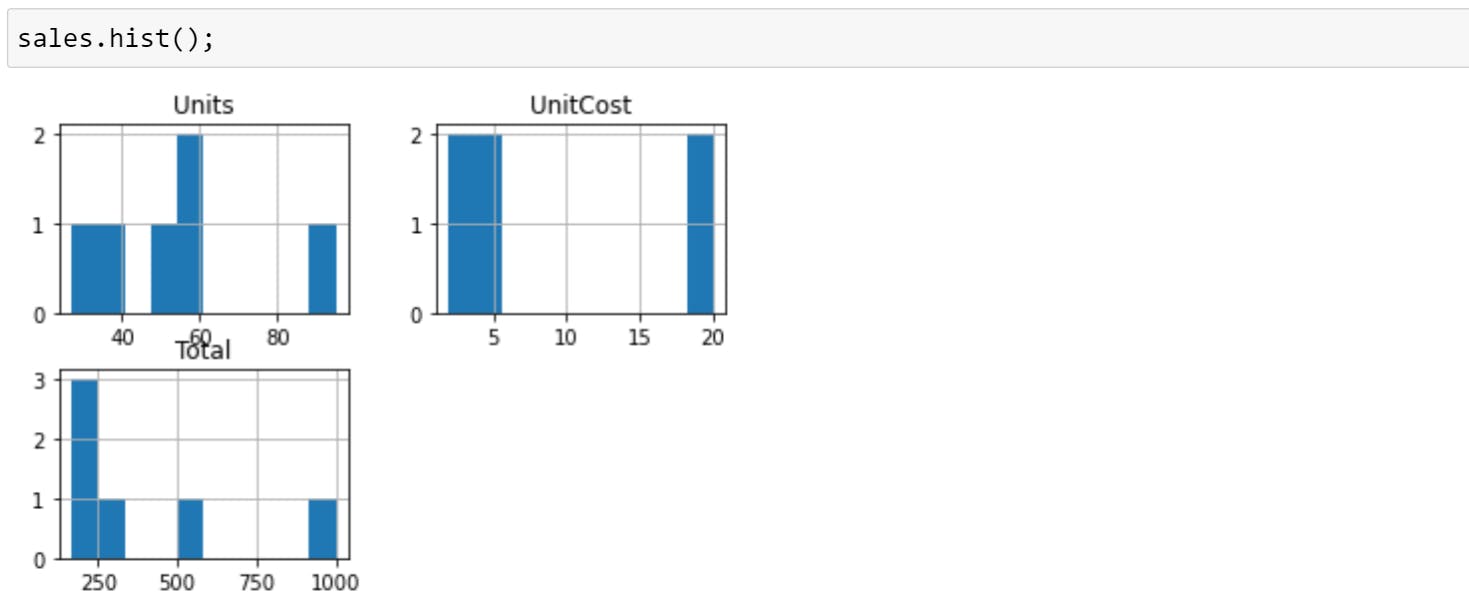
You can see the distribution of a column by calling .hist() on you. The distribution of something is a way of describing the spread of different values.
I hope this helps and let me know if you want to add anything.